GAIT
GAIT is movement being observed in a experiment, our question was if we could figure out someone's height based off their Gait analysis.
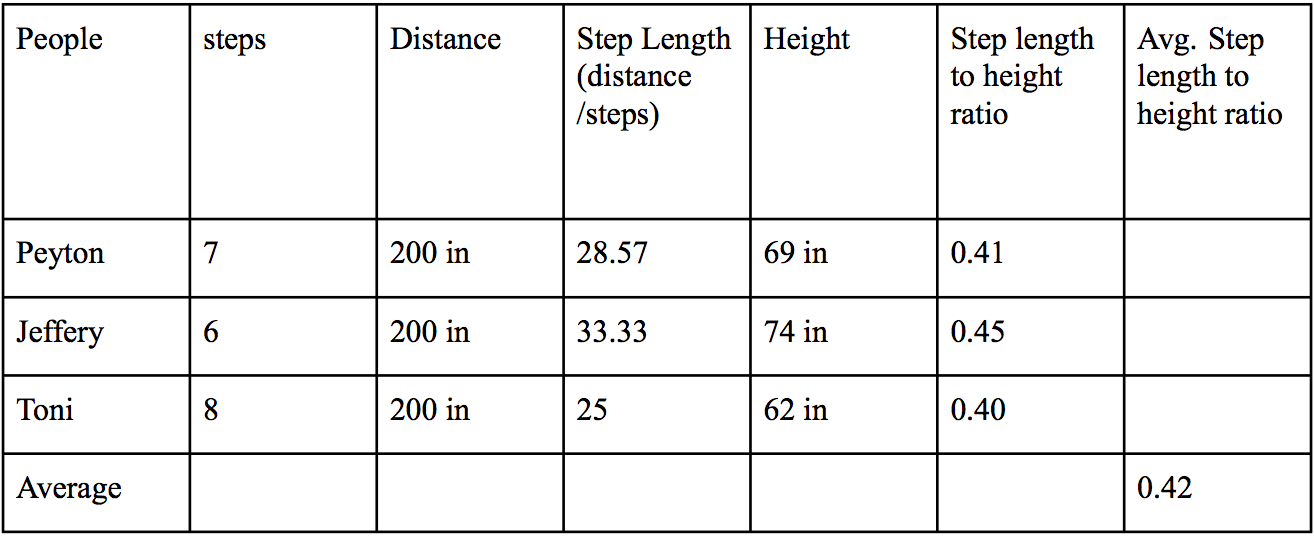
First, we measured the acceleration of the x, y, and z axis, of 3 different people of varying height. Our equation for GAIT was Y=(200/x)/(0.42) where X= is the number of steps and Y= the estimated height. In our case the 200 is the distance we all walked and .42 was the constant we found all together. The axis of X plotted in a graph would be the lateral velocity and Y would be the vertical velocity and Z would conclude the longitudinal velocity. With the data that we have received from the experiment we made a finalized table to show the average steps length to height ratio. This table is shown below
Gait data:
Slides: An overview from the google doc
Doc: The detailed version of the GAIT analysis
Content: |
GAIT: The study of human motion; A person's manner of walking
Velocity:The speed of an object at a given direction Acceleration: Increase in the rate or speed of something Accelerometer: A device used to track acceleration in an object |
Reflection: |
Overall, we did really good as a group and the project was done on time and well. The challenge we had during the experiment was how to graph the points that were in the table. Both the graph and table were a mess, we had a lot of points plotted which made the graph look like a roller coaster. In this project I learned how to use an accelerometer and what it was in general. A couple things to work on is to figure out how to find a proper equation, and to create graphs.
|
